
- Access to the dashboard in the intended workspace
- Permission to open the source records behind the signal
Today's command brief
- At-risk deals
- Open commercial records with evidence that requires intervention; open the deal to understand the reason
- Replies waiting
- Conversations whose current state indicates customer response work; open the thread before assigning or replying
- Quotes needing action
- Failed sends, due follow-ups, expiring offers, or another attention state in the quote queue
- Response health
- Saved-channel SLA attainment when available, otherwise qualifying response-time evidence or an insufficient-sample state
These metrics answer different questions. A reply can be waiting without being beyond SLA. A quote follow-up can be due even when the originating conversation is closed. A high pipeline amount can reflect several currencies or incomplete values; read the displayed coverage and source deal.
 Open full size
Priority and tone
Dashboard color and order indicate attention, not moral judgment:
- Critical/danger: a condition such as overdue timing or failed delivery needs prompt inspection.
- Warning/due soon: time, risk, or data coverage could become consequential.
- Neutral: information is available but not classified as immediate risk.
- Ready/on track: no current rule has identified attention in that scope.
Always open the record. A recently resolved customer promise may remain in a summary until the source update is processed; a green summary may omit work whose required fields were never recorded.
Attention now and Priority Queue
Attention now selects a small set of high-impact items. Priority Queue expands ranked commitments across replies, outcomes, SLA, deals, and quotes. Ranking uses recorded urgency evidence such as priority, due dates, SLA, and revenue context.
Use the rank to choose where to look first, then apply customer and business judgment. For example, an urgent but duplicate test record should be corrected rather than handled ahead of a lower-ranked real customer commitment.
Conversation velocity
Conversation velocity displays message volume across available channels for 7, 30, or 90 days. It measures activity, not resolution quality. A spike can mean growth, a successful campaign, or a service incident. Compare it with replies waiting, response health, and resolution outcomes before drawing a conclusion.
Channel filters change the scope. State the selected period and channel whenever you share the chart.
Pipeline stage flow and Revenue
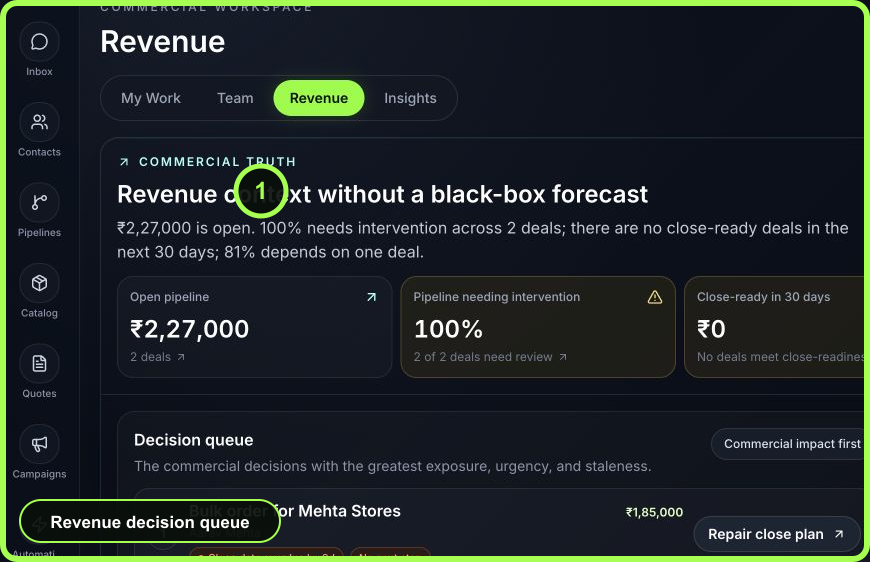
Pipeline signals depend on deal stage, value, close timing, follow-up, and other source evidence. Treat at-risk value as explainable attention, not a black-box forecast. Open deals with missing dates, mixed currency, or incomplete ownership can produce limited or non-comparable summaries.
Response health
Response evidence can include average first response and percentage within saved channel SLA. Interpret it with:
- the period and qualifying reply sample count;
- the selected or configured channel scope;
- saved SLA configuration; and
- whether automated or non-customer activity is part of the qualifying set.
No samples or Awaiting reply samples means WRKZY cannot calculate the displayed result from current evidence. It is not zero minutes and not 100% attainment.
Workspace readiness
- Channel health
- Current provider connection and recent operating evidence for available channels
- CRM relationships
- The share of active contacts linked to company context in the dashboard's scope
- Automation rules
- Enabled rules and a path to review run health
- Ready
- No configured readiness rule currently requires attention
- Needs attention
- A warning or incomplete relationship condition exists
- Action required
- A connection or operating dependency needs direct inspection
Workspace readiness helps explain why queues or reports may be incomplete. Fix the source system—connection, record relationship, or automation run—not the dashboard card.
Insights coverage states
| State | Meaning | Decision |
|---|---|---|
| Available | The section has qualifying data for the displayed scope | Interpret trend, then inspect representative records |
| Insufficient history | The feature is configured but lacks enough elapsed or qualifying data | Keep operating consistently; do not fill with manual assumptions |
| Failure/unavailable | The section could not load or calculate | Retry, then capture the section and timestamp for support |
| Setup needed | Reporting timezone or another dependency is missing | Ask an Owner/Admin to complete the linked setting |
A practical interpretation example
If Replies waiting = 8, SLA warnings = 2, and response health has No samples, you can conclude that eight conversations appear to need response and two are near or beyond the saved SLA boundary. You cannot conclude the team's average response time. Open the two SLA items first, verify the threads, then investigate why qualifying reply evidence is absent.
Verification checklist
- Workspace, view, channel, and period stated
- Coverage or sample state read
- Metric definition kept separate from business conclusion
- Representative source record opened
- Owner and next action confirmed
- No-sample state left as unknown rather than treated as zero